
| Disassembler - Debugger - Auto-Hack | |
|
Auto-Hack lists all the addresses of code that read, write, or access a given address. The Auto-Hack feature can be found in the Disassembler’s Helper window. The Debugger must be active for the Auto-Hack feature to function.
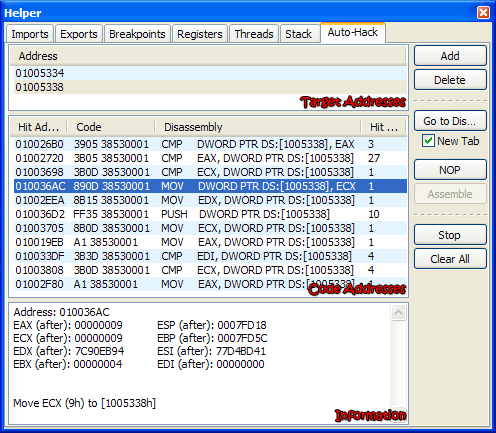
The Auto-Hack window is divided into 3 parts: target addresses, code addresses, and information.
Target AddressesThese are the addresses whose read/write code you want to find—that is, you want to find the code that reads/writes these addresses. You can have as many addresses in this list as you please.
Code AddressesThis lists the addresses of instructions that read, wrote, or accessed one of the target addresses. This pane is empty if no address is selected from the target addresses. This pane shows the address of the instructions, the bytes that make up the instructions, the instructions themselves, and the number of times the instructions read, wrote, or accessed the respective target address. To view an item in the Disassembler, select it and press the Go To Dis... button. If New Tab is checked the item will be opened in a new tab. To NOP an item (change the code to perform no action), select it and press NOP. To get more information about one of the items in this pane, select it.
InformationWhen an item is selected from the Code Addresses list, more detailed information about it is shown here. This pane shows the registers at the time of the read, write, or access, and explains the instruction. If hardware breakpoints are used for the Auto-Hack feature (see Disassembler - Options), the registers shown here are the registers after the instruction was executed. If it is important to know the registers before the instruction was executed, use software breakpoints. For more information regarding the differences between software breakpoints and hardware breakpoints, see Disassembler - Debugger - Breakpoints. The registers shown are from the first time the instruction was executed.
MiscellaneousThe Auto-Hack feature uses breakpoints to carry out its operations. As noted on the Disassembler - Debugger - Breakpoints page, breakpoints are organized into layers. While the Auto-Hack feature is active, user breakpoints will not be hit. To enable user breakpoints, stop the Auto-Hack feature by pressing Stop or Clear All. The Stop button temporarily stops the Auto-Hack feature, leaving the Target Addresses in the list. Auto-Hack can be resumed by pressing Start. The Clear All button stops the Auto-Hack feature and clears all Target Addresses. Similarly, if you manually delete all Target Addresses, Auto-Hack will automatically shut down and user breakpoints will become active again. |
Copyright © 2006 Shawn (L. Spiro) Wilcoxen |
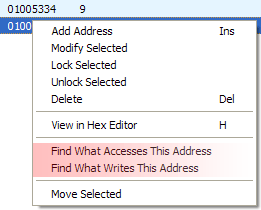 You can add addresses manually by pressing the Add button. The most common way to add addresses to this list, however, is by right-clicking addresses from the main list and selecting Find What Reads/Writes/Accesses This Address.